
Modernize Oil & Gas O&M With Connected Field Data
Oil & gas operations depend on accurate field information about facilities, equipment and asset condition. aQRate connects structured field inspections, photographs, measurements and asset records into a unified workflow — giving O&M teams a clearer path from field data to spatial, 3D and analytical views.
Your O&M Data Is Only as Useful as the Context Around It
Oil & gas O&M teams collect information through recurring inspections, maintenance checks, field logs, photographs, measurements and equipment-specific records. When that information is captured in disconnected forms, spreadsheets or isolated systems, the resulting dataset can lose the context needed to understand what happened, where it happened and how observations relate to surrounding equipment.
Many field workflows still rely on combinations of paper round sheets, ad-hoc spreadsheets and photo folders — not because teams prefer them, but because connecting structured inspection data to the asset it describes has been hard to do.
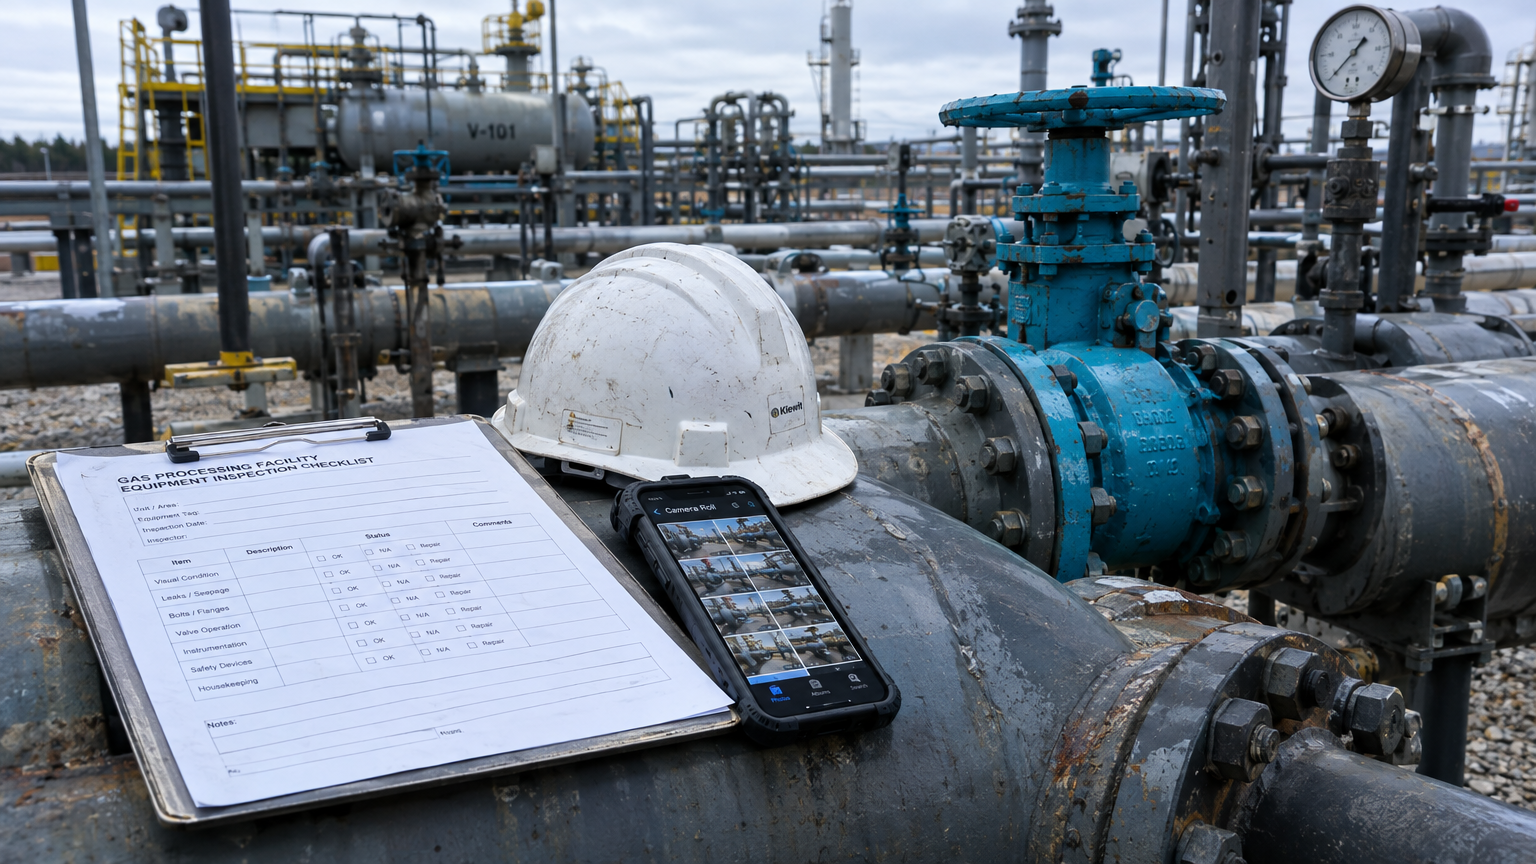 Field data is captured in real conditions — the problem is what happens to it afterwards, when each record travels alone.
Inconsistent asset naming
Tags and equipment names vary between crews and rounds.Disconnected field records
Submissions end up scattered across forms and systems.Photos without records
Evidence lands in camera rolls, not on the inspection.Manual consolidation
Spreadsheets merged by hand before anyone sees the data.Hard cross-asset correlation
Observations across equipment and facilities don't line up.Limited spatial context
Hard to see where an observation sits in the plant.Static tables
Row-and-column views hide relationships between records.Repeated data handling
Information is re-keyed on its way to engineers.Condition over time
Comparing asset history round-to-round is slow.One Connected Workflow From Field Inspection to Operational Insight
aQRate is a field data collection and inspection-management platform. Build structured mobile forms, collect offline in the field, sync to a web portal, and connect submissions to the facilities, equipment and locations they describe — then visualize the same records as reports, maps, dashboards and 3D views. This short overview shows the general platform before the oil & gas O&M demo below.
01
Field Data
structured inspections, photos, measurements02
Connected Asset Records
facility → stage → equipment → valve03
Spatial & 3D Context
GIS facility view, interactive digital twin04
Operational Insight
dashboards, trends, configured analyticsCapture O&M Data Where the Work Happens
Field technicians use structured mobile forms to capture facility and equipment information on site — during recurring inspections, maintenance rounds and valve surveys. The point is not simply to digitize a paper form: it's to capture structured O&M information in a format that remains connected to the asset and the rest of the project dataset.
What a round can capture
- Facility identification
- GPS location
- Inspection date
- Asset / equipment ID
- Equipment condition
- Measurements
- Valve inspection records
- Photographs
- Observations
- Maintenance status
- Inspection results
- Nested child inspection records
The Oil & Gas O&M template ships with forms like "O&G Valve Inspection - Repeated Form" and "O&G Facility & Compressor Inspection", ready to configure around your facility hierarchy.
Standardized dropdowns
Valve tags, functions, positions and integrity states are picked from controlled lists — not typed freehand, so V-104 is always V-104.
Required fields
An inspection can't be submitted without the fields your workflow depends on, like valve tag, function, position and integrity.
Photos linked to records
Photographic evidence attaches to the inspection it belongs to, with the asset and date — not to a camera roll.
Nested child forms
Record each valve under its parent equipment inspection as a repeatable child record, round after round.
Offline field collection
The iOS and Android apps keep working with no signal at the manifold or the compressor deck, and sync when a connection returns.
Structured data, not just a digitized form
Captured in a format that remains connected to the asset and the rest of the project dataset.
Start From the Oil & Gas O&M Template
Watch the template's real valve inspection form assemble itself and take a field entry — the same workspace you get with the Oil & Gas O&M starter template, sample records included.
O&G Valve Inspection- Repeated Form
Valve Tag*
Function*
Position*
Integrity*
Inspection Photo Evidence
O&G Valve Inspection- Repeated Form
V-106
Train 2 Bypass
Fully Closed
No Leak / Nominal
Photo captured
Report ready: Compressor Integrity Audit Report
Keep Facilities, Equipment and Inspection Records Connected
aQRate links records through the workflow, so a nested valve record stays attached to its parent inspection, the equipment, the processing stage and the facility. When a technician logs valve V-104 on the inlet header next month, it lands in the same connected history — no re-keying, no guessing which asset a photo belonged to.
Natural gas processing facility
Illustrative demo facility from aQRate's Oil & Gas O&M Demo Use Case — not a real customer plantStage 1
Stage 2
Stage 3
Inlet header piping & valve system
Subsystem within its stage, carrying its own inspection historyO&G Facility & Compressor Inspection
A round captured with the template's facility form — date, GPS, facility ID, equipment conditionValve V-104 — Header 1 Iso
Nested, repeatable child record from "O&G Valve Inspection - Repeated Form" · Position: Fully Open · Integrity: No Leak / NominalSee O&M Data in Its Operational Context
The same connected records, seen two ways. Start from the map to find the facility, step into the 3D environment to see where equipment sits, then drill into the inspection detail and field evidence behind it.
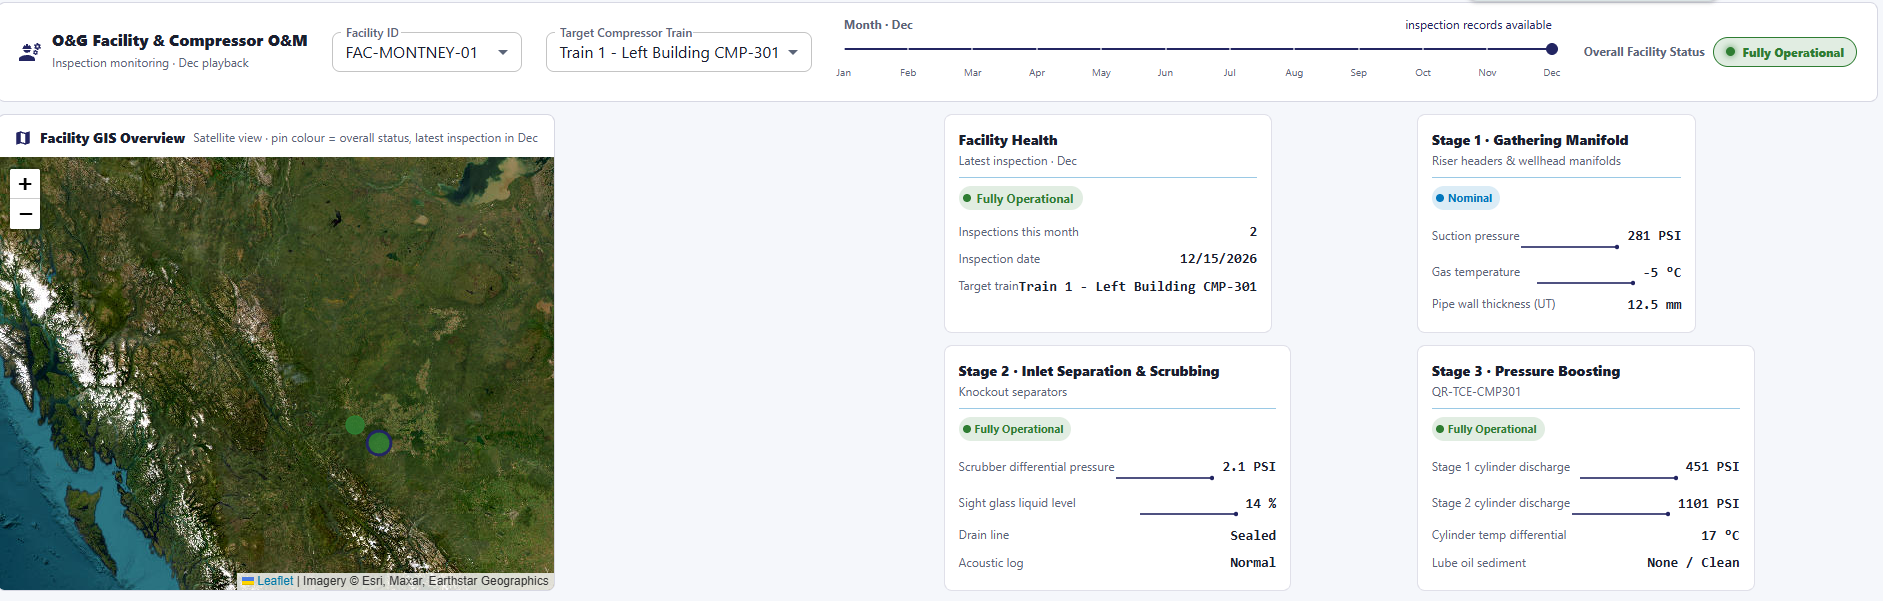
01 — GIS FACILITY VIEW
Locate the facility, then open its O&M records
Facility-level GIS visualization provides geographic context and allows teams to move from facility location into the underlying O&M information. In the demo, each facility point carries its connected inspection submissions — from the field round down to the valve records.
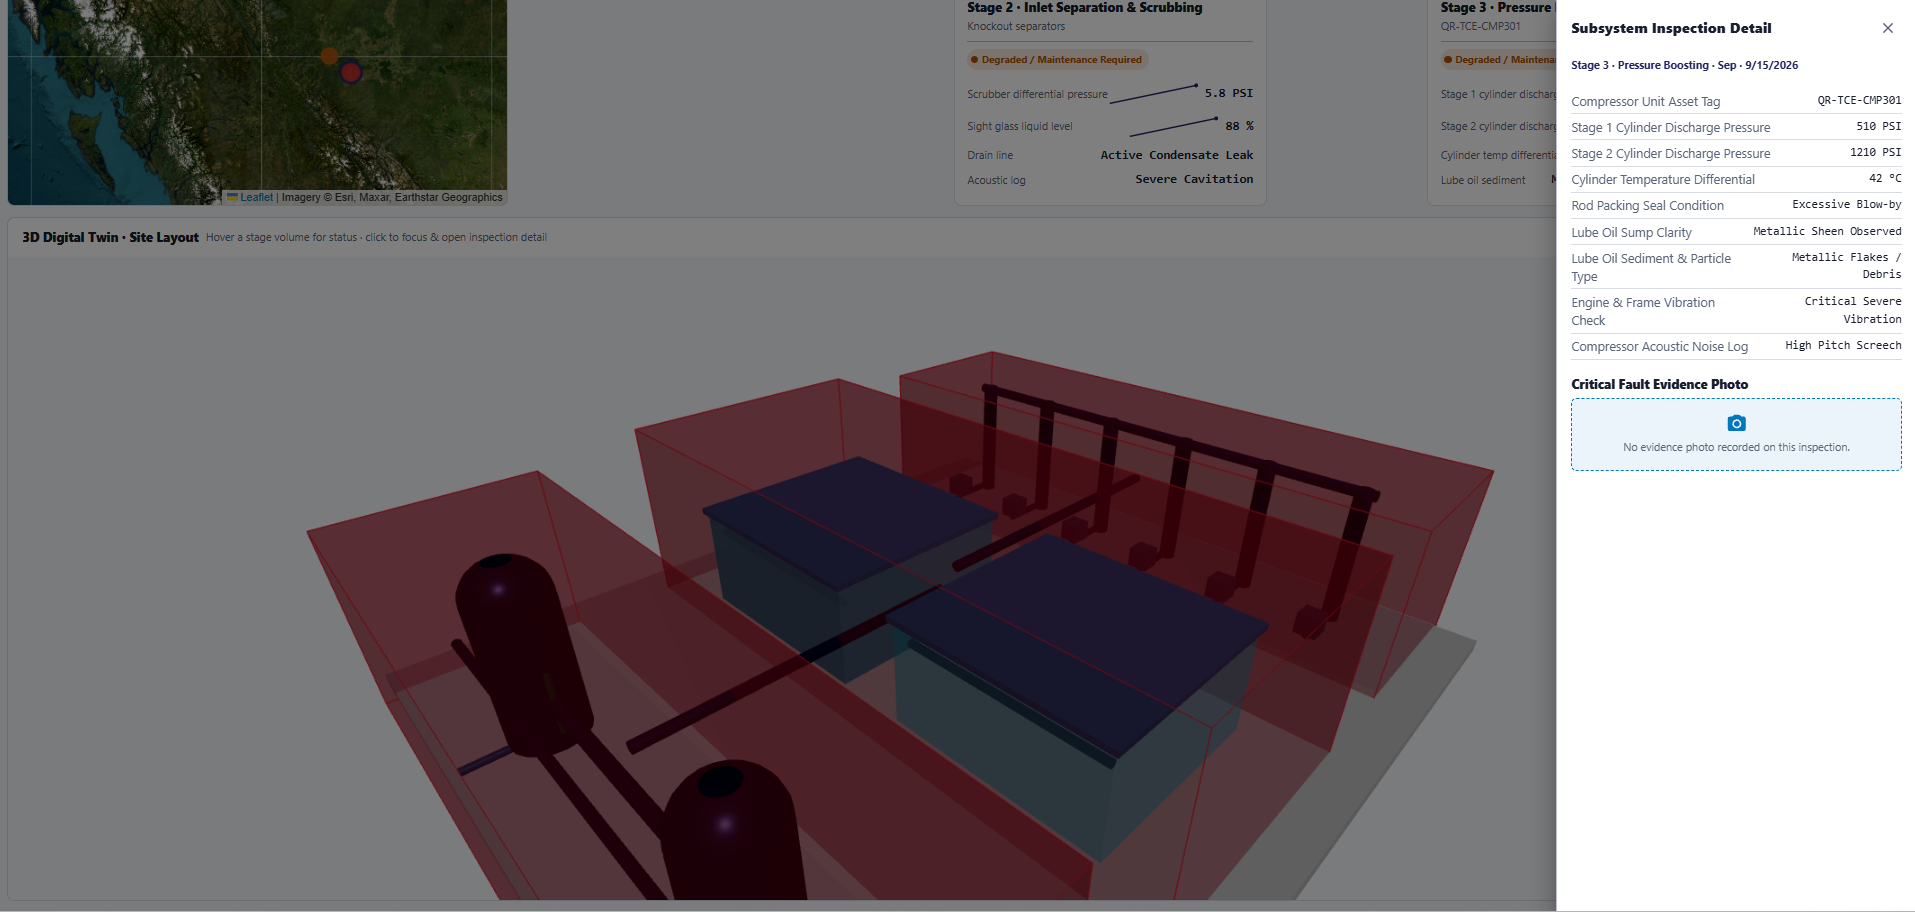
02 — INTERACTIVE 3D DIGITAL TWIN
Explore the facility the way crews walk it
The interactive 3D view provides spatial context for facility stages, equipment and inspection information, helping users explore field data in relation to the physical environment. Observations from the gathering manifold, inlet separation and pressure-boosting stages become visible in one common operational context.
Add Time and Context to O&M Data
Because inspection records stay structured and connected, configured analytics can help teams visualize trends, thresholds and relationships in their inspection data: equipment condition over time, valve inspection states, comparisons between similar equipment, and how measurements relate across a facility.
Measurements over time, against a threshold
Valve V-104 wall-thickness readings (mm) across six inspection rounds, with the minimum specification line.- Measured thickness (mm)
- Minimum spec (4.8 mm)
Valve inspection states by processing stage
Integrity findings recorded with the template's controlled integrity list, grouped by facility stage.- No Leak / Nominal
- Minor Weeping
- Active Gas Leak
From Field Inspection to an Interactive Facility Digital Twin
Our Oil & Gas O&M demo — "Modernizing Oil & Gas O&M: Elevating Field Data Into Interactive 3D Digital Twins" — walks the full workflow in one illustrative three-stage natural gas processing scenario.
Field Inspection
A technician captures structured facility and equipment information on a mobile form — valve tags, positions, integrity states, measurements and photos.
Connected Records
Facility, stage, equipment and nested inspection records remain linked as the submission syncs to the portal.
GIS Context
Facilities can be viewed geographically, so teams start from the map and move into the O&M record behind each location.
3D Facility Context
The facility can be explored through an interactive 3D representation — stages, equipment and their spatial relationships.
Inspection Detail
Users can move from a facility or spatial area into associated inspection information and field evidence, without leaving the workflow.
Operational Analytics
Configured analytical views help explore measurements, conditions, trends and relationships across the connected dataset.
The demo scenario: three processing stages, one connected dataset
Stage 1
Gathering manifold
Inlet piping and valve systems — header isolation valves, ESD blowdown and diverting streams, inspected as repeatable valve records.
Stage 2
Inlet separation & scrubbing
Separation and scrubbing equipment, with condition and maintenance status captured per subsystem.
Stage 3
Pressure boosting
Compressor systems and bypass trains, inspected on the facility & compressor inspection form.
Built for Teams Managing Complex Oil & Gas O&M Workflows
Oil & Gas Operators
Teams managing recurring facility and equipment inspections across batteries, plants and compression stations.
Asset Integrity Teams
Teams responsible for organizing inspection information and asset condition records — with the evidence attached.
Field Inspection Teams
Technicians collecting equipment observations, measurements and photographic evidence round after round.
Maintenance & Reliability Teams
Teams that need historical field information and equipment context to support maintenance decisions.
Engineering & Technical Teams
Teams that need structured field information connected to the assets and locations they analyze.
O&M Contractors
Organizations performing recurring inspections and maintenance-related field data collection for facilities or clients.
Getting started
From signup to insight in six simple steps
Create your free account
Create your aQRate workspace and start building your Oil & Gas O&M workflow.
portal.aqrate.caDownload the mobile app
Download the aQRate mobile app for field data collection.
Build or choose a survey form
Start with the Oil & Gas O&M template or configure forms around your facility, equipment and inspection workflow.
Collect data in the field
Capture structured inspection information, measurements, observations and photographs from the field, including offline where applicable.
Review your submissions
Synchronize field records and review connected facility and equipment information in the aQRate portal.
Generate reports and visualizations
Turn structured O&M records into configured reports, maps, dashboards, 3D views and analytical visualizations.
Build a More Connected Oil & Gas O&M Workflow
Bring field inspections, asset records, photographs, measurements and operational context together in one connected workflow. Start with an Oil & Gas O&M template and configure the data, records and visualizations around your team's process.